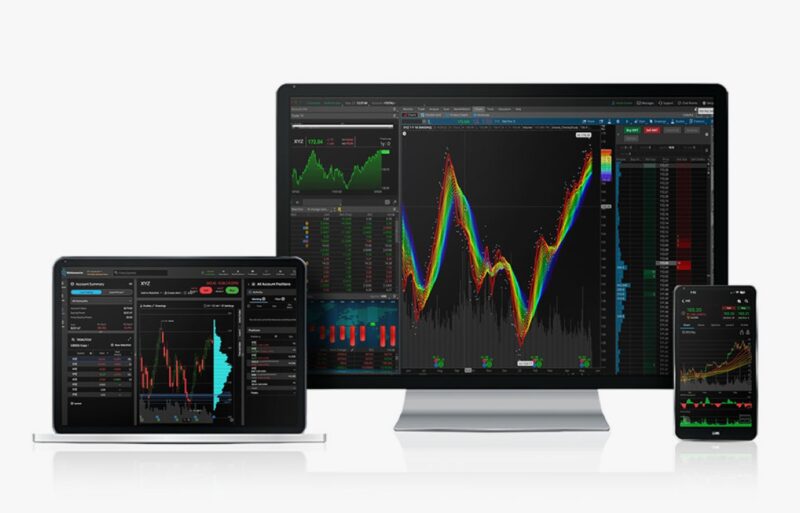
For anyone looking to jump into the world of technical analysis, finding the right tools can be the difference between growing your portfolio or…well, not. Tools give you insights, and insights can turn into good calls. You don’t need to be an expert to get started, but knowing what to use saves a lot of time and confusion. Let’s talk about the tools that can set you up to make informed moves, track trends, and read market signals with confidence.
Key Points
- Essential tools for analyzing price trends and patterns.
- Benefits of using a solid platform for new traders.
- Key indicators to check for reliable signals.
- Top software choices for charts, graphs, and indicators.
- FAQs to answer common questions about technical analysis tools.
1. Start with the Basics – A Reliable Platform

To get serious with trading, finding a solid platform is step one. Something that’s user-friendly and packed with features can make the experience smoother. One option that stands out is Binomo, a platform that lets users register and start with a $10,000 demo account. This is a helpful way to practice without real stakes, getting comfortable with market analysis before investing real money.
Platforms like this provide easy access to graphs, indicators, and signals. These are the foundation of technical analysis. Having a good platform on your side is like having a map for navigating the market. It shows you where things are headed, highlights patterns, and lets you work with tools that tell a story about market trends.
2. Must-Have Indicators to Know
Indicators are like market signals. They help you spot trends, shifts, and tell you when it’s time to step in or step out. Each indicator has a different purpose, so using a combination gives you a fuller picture.
- Moving Averages (MA) – Moving averages smooth out price data, making trends clearer. They help you spot potential price shifts and act as a basic guide to where things might go next.
- Relative Strength Index (RSI) – This one tells you if a market is overbought or oversold. RSI gives a percentage score, and a high percentage (usually above 70) suggests prices may soon decline, while a low score (below 30) hints at a possible upward trend.
- MACD (Moving Average Convergence Divergence) – MACD highlights momentum shifts and gives entry and exit points. It’s particularly useful in volatile markets, as it signals both reversals and continuations.
- Bollinger Bands – These measure market volatility. When prices move close to or touch the bands, it’s usually a sign of an impending change in direction.
3. Charting Software – Tools for Visual Analysis

Visualizing market patterns gives you a leg up in trading. Good charting software offers indicators, customizable charts, and other features that allow you to analyze trends closely. Below are some of the best options:
| Software | Key Feature | Purpose |
| TradingView | Interactive charts and social aspect | Great for collaboration |
| MetaTrader 4 | Includes a wide range of indicators | Best for Forex and CFD trading |
| ThinkOrSwim | Detailed chart customizations | Perfect for in-depth stock analysis |
Using charting tools lets you layer multiple indicators, make annotations, and set alerts. The goal is to let the charts tell you something important—patterns, potential reversals, or steady trends.
4. Risk Management Tools – Keep Your Portfolio Safe
Risk management is essential. The right tools here can prevent big losses and keep your portfolio steady. Some of the key options include:
- Stop-Loss Orders – This is a way to automatically sell if prices hit a level where you’re no longer comfortable holding on. It helps limit losses.
- Position Sizing Calculators – These tools help you determine the right amount to invest based on risk tolerance. Avoid putting everything in one trade.
- Risk-Reward Ratio Calculators – These help you assess if a trade has a good balance between the risk taken and the potential return.
5. Strategy Development Tools – Plan Before You Act

Going in without a game plan? That’s a recipe for mistakes. Tools here give you structured approaches and let you test your strategies in real-time.
- Backtesting Software – Software like QuantConnect allows you to see how your strategy would perform based on historical data.
- Paper Trading Accounts – Many platforms offer these accounts for testing strategies without risking real money. It’s a practical way to tweak and test.
- Trading Journals – Keeping a trading journal tracks what works and what doesn’t. It’s a tool for self-analysis.
FAQ
1. What is a Moving Average in simple terms?
A Moving Average shows the average price over a set period. It smooths out price fluctuations, making trends easier to spot.
2. Do I need expensive software to start with technical analysis?
Not necessarily. Many free tools provide basic charting, indicators, and analysis features, which is often enough for beginners.
3. How does a demo account help in technical analysis?
A demo account lets you test strategies without risking money, helping you understand different indicators and market movements.
4. Are indicators enough for making decisions?
Indicators are helpful but not foolproof. They work best when used together to confirm trends and signals.
5. What is risk management, and why is it crucial?
Risk management means using tools like stop-loss orders and position sizing calculators to minimize losses and protect your capital.
Conclusion
Knowing what tools to use in technical analysis puts you in control. Platforms, indicators, charting software, risk management tools, and strategy planners all serve unique purposes. Having them in your toolkit makes the process easier and smarter, and you’ll find that making moves becomes more strategic than risky. Whether you’re just testing the waters or already diving into trades, these tools are there to help you grow with confidence.


